Your first hour in Viewer#
Course step 3 of 9 · about 30 to 60 minutes
By the end of this page you will have loaded a session, plotted parameters, moved around in time, overlaid a second session and saved your layout as a workbook. Each step links to the reference page if you want the full detail.
Before you start#
You need three things:
- ATLAS Viewer installed. Versions are available from the Motion Applied Portal. Check the system requirements first (Windows 11, 16 GB RAM or more recommended).
- A licence. Open the Licence Manager utility and add your licence code. Licence options decide which features appear, for example CSV/ASCII import. See Adding a Licence.
- Something to look at. Ask your team for a session file (
.ssn2) or the details of a shared SQL Race database. If all you have is a CSV file, see Getting your data in.
1. Start Viewer#
Start ATLAS Viewer from the Start menu. A new workbook opens with one empty page.
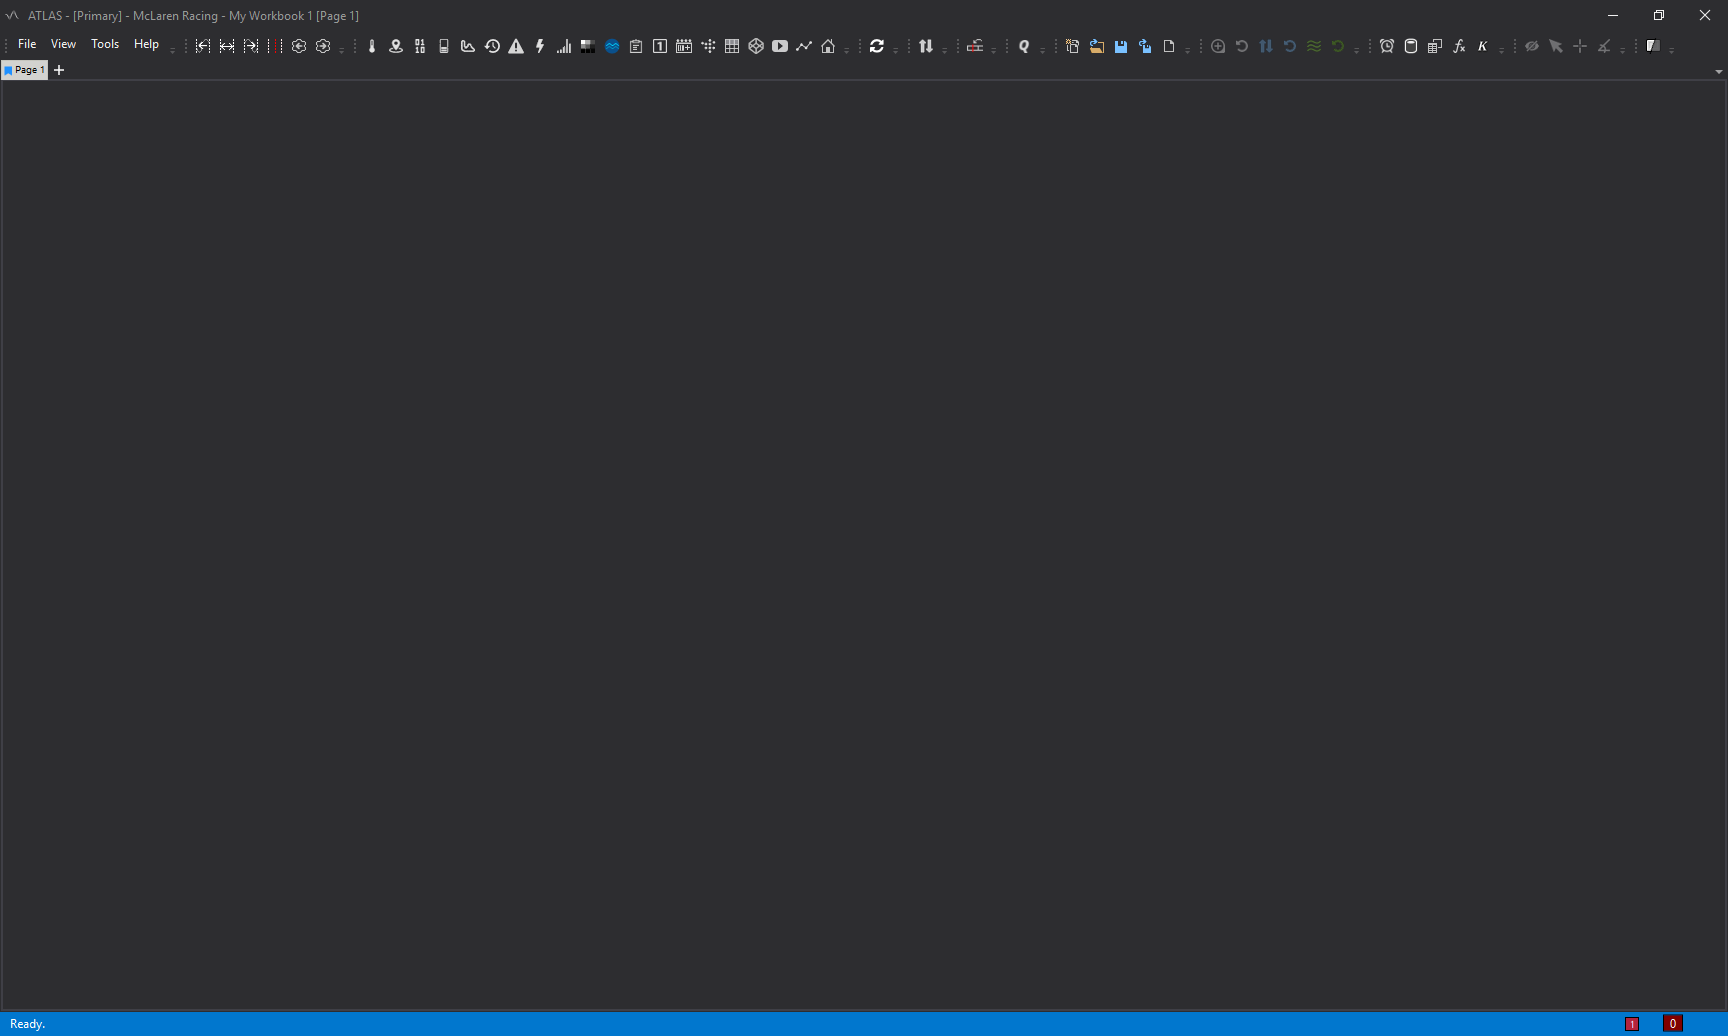
The empty page is expected. Viewer has not been told what data to show yet.
2. Open the Session Browser and load a session#
Press Ctrl+L to open the Session Browser. It has six panels. For now you need these four:
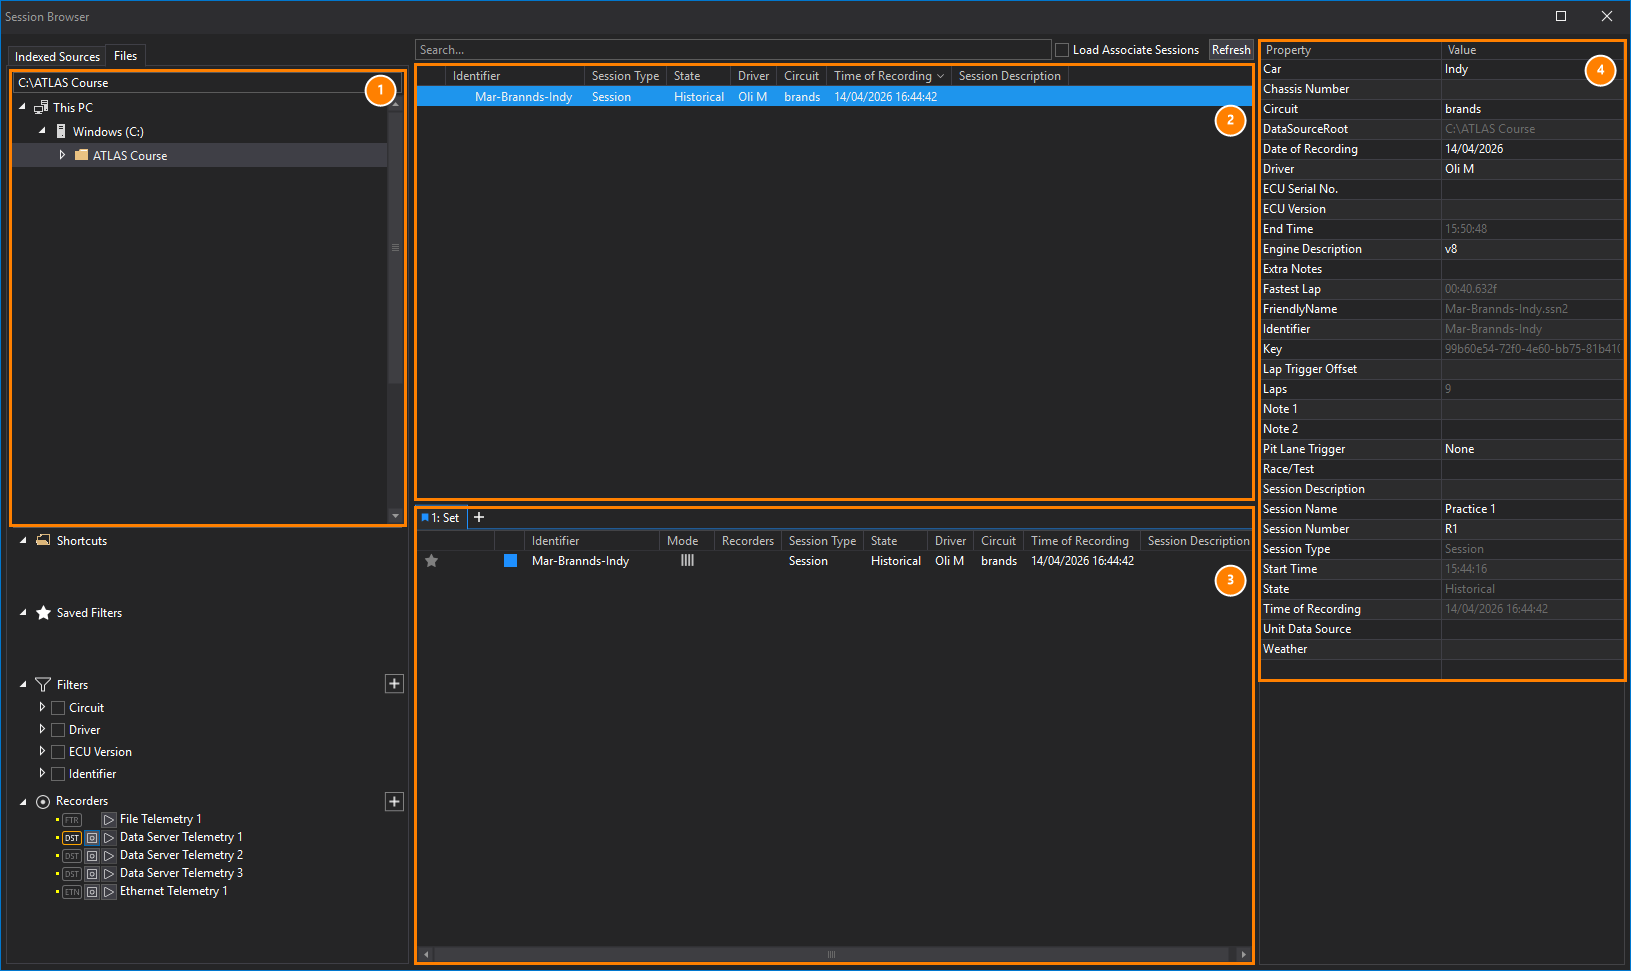
| Panel | What to do | |
|---|---|---|
| 1 | Session Sources | Tell Viewer where to look. Use the Files tab to browse to a folder of session files, or right-click and choose Connection Manager... for a SQL Race database. |
| 2 | Session List | Shows the sessions in the sources you picked, with metadata such as driver, circuit and time of recording. Use the filters or the search box to narrow down. |
| 3 | Compare Sets List | Shows what is loaded. Each tab is a set. |
| 4 | Session Properties | Shows the details of the selected session, such as car, circuit, fastest lap and number of laps. |
Select a session and press Enter (or double-click it). It appears in the Compare Sets List (3), which means it is loaded into the current set. Press Esc to close the Session Browser.
Nothing can be plotted until a session is loaded
This is the most common reason for a blank display. The workbook holds layout. The data comes from the set.
3. Add a display#
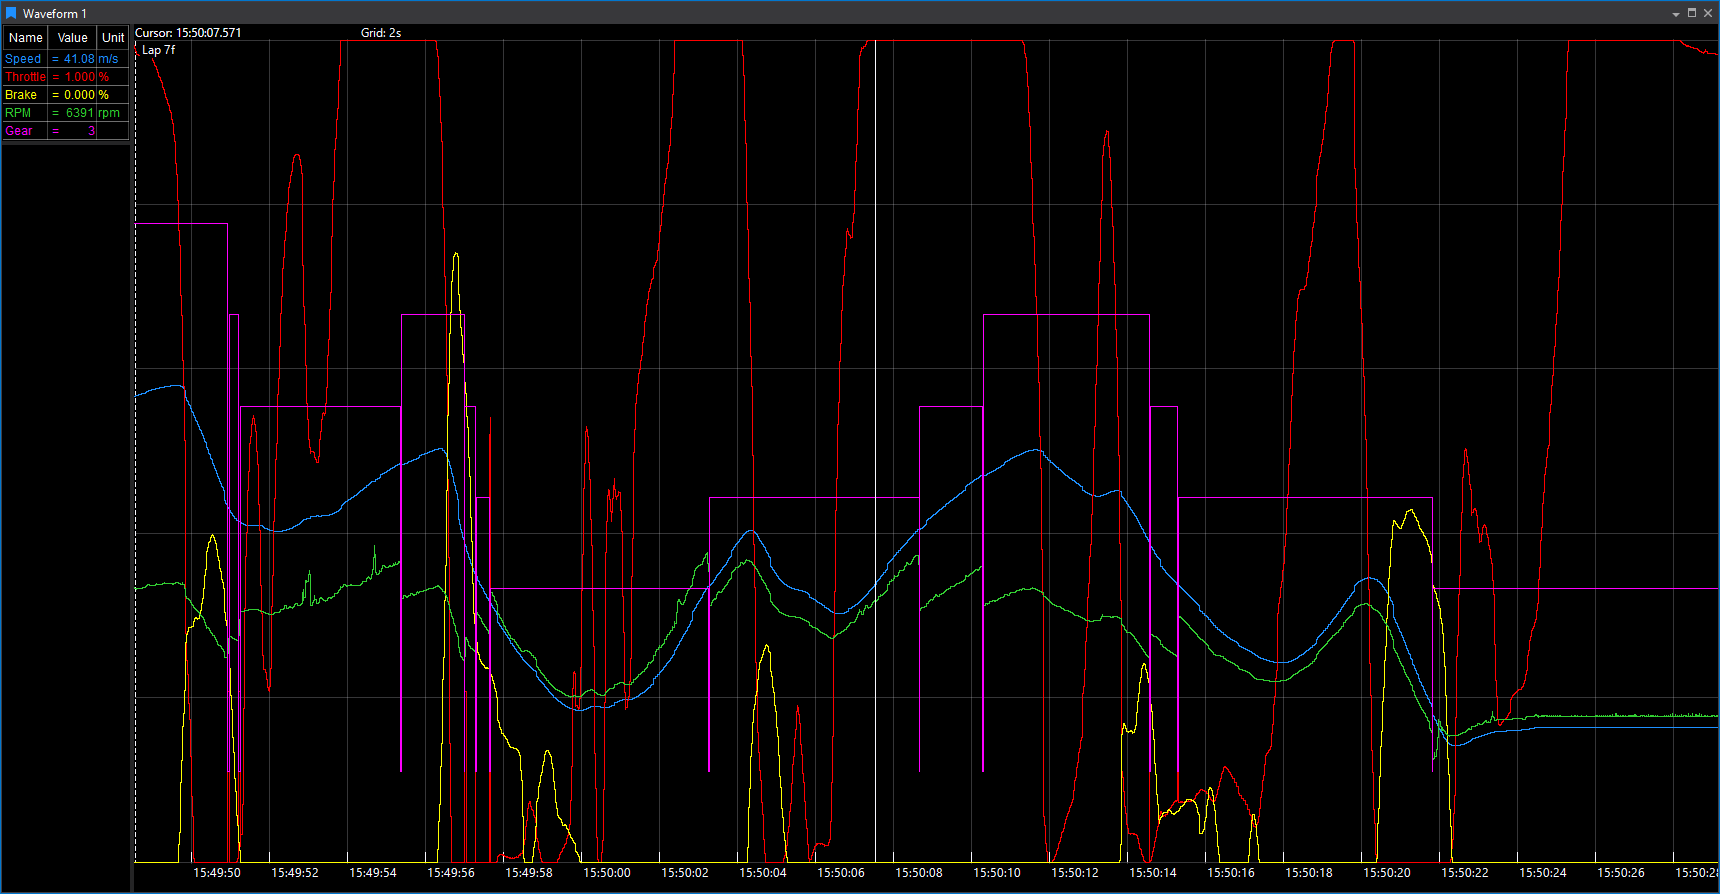
Press Ctrl+Q twice, type Waveform, and press Enter. A Waveform display opens. It plots parameters against time (or distance) and is the display you will use most.
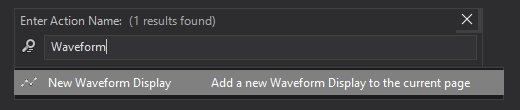
Other ways to add a display are the display toolbar and File > New > Display. See Displays for all 20 or so types.
4. Add parameters#
With the Waveform selected, press P to open the Parameter Browser.
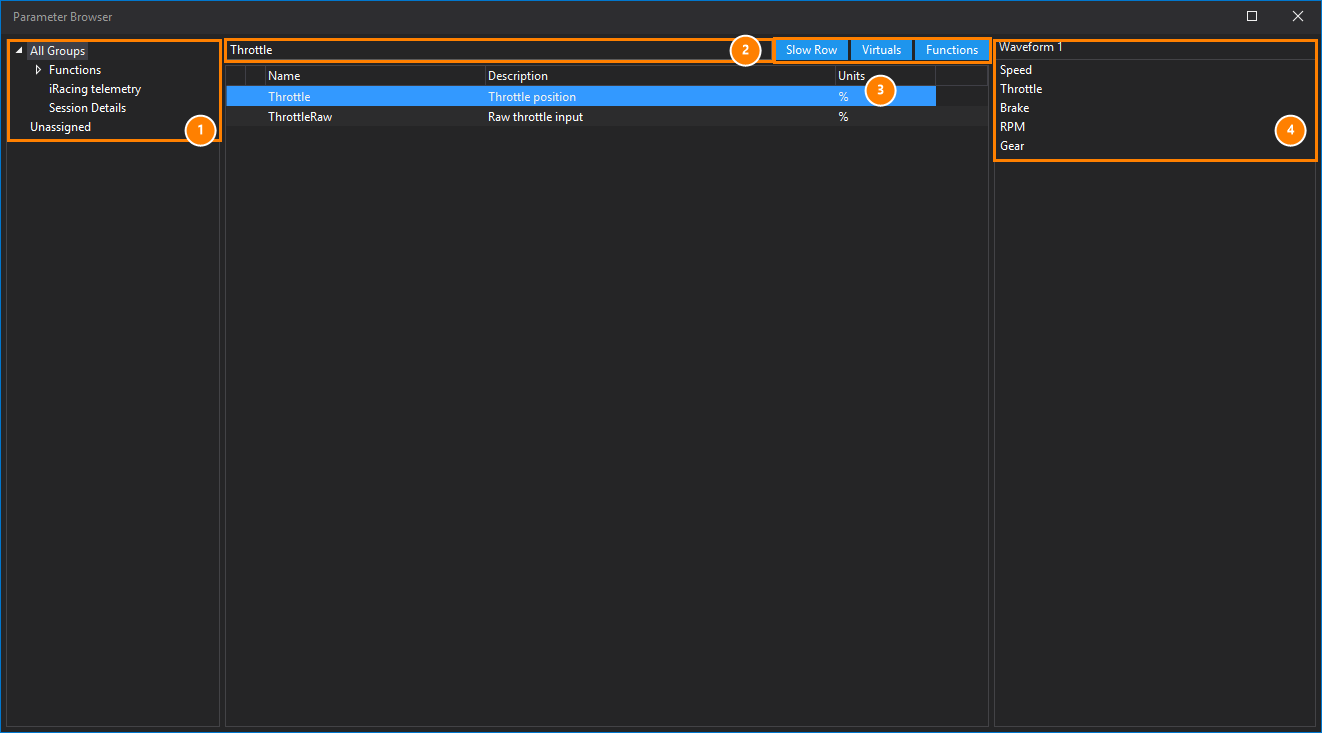
- The left panel lists application groups, which organise parameters by source or subsystem. Choose All Groups if you are not sure where something is.
- Type in the search box to find a parameter by name, description or group. Use
*as a wildcard. - The Slow Row, Virtuals and Functions toggles show or hide those kinds of parameter.
- The right panel lists the parameters already on the selected display.
Press Enter, double-click, or drag a parameter onto the display to add it. Add three or four parameters, then press Esc. Each parameter gets a trace and a row in the legend with its value at the cursor.
What if the parameter I expect is missing?
Check All Groups, check that the Functions and Virtuals toggles are on if it is a calculated channel, and check the session really contains it. In the Selected Parameters list, parameters with no data are greyed out. See Channels and calculated parameters.
5. Move around in time#
| To do this | Do this |
|---|---|
| Zoom in and out | Scroll wheel over the Waveform |
| Zoom to a region | Right-click, hold and drag to select, then choose Zoom |
| Scroll left and right | Hold both mouse buttons (or the middle button) and move the mouse |
| Place the cursor | Click in the display. The cursor is synchronised across displays |
| Jump to the start or end | Home / End |
| Select a whole lap | Double-click it in the Timeline along the top |
The Timeline at the top of the window shows the session length and its laps, and controls what time range the displays show.

- The loaded session and the lap shown.
Lap 7fmeans lap 7, the fastest lap. Click the arrow to pick another lap. - Previous Lap and Next Lap.
- The whole session. Each white block is a lap, and the shaded region is the time range the displays show.
6. Overlay a second session#
Back in the Session Browser (Ctrl+L), select a second session and press Enter. It joins the same set, and the Waveform shows both, with a header and colour stripe for each session in the legend.
Two other ways to load a session, which you will want later:
| Keys in the Session List | Result |
|---|---|
Enter |
Add to the current set |
Ctrl+Enter |
Add to a new set |
Shift+Enter |
Replace the sessions in the current set |
With more than one set, Shift+1, Shift+2 and so on point the selected display at that set, and Ctrl+1, Ctrl+2 point every display on the page. See Loading sessions.
7. Save your workbook#
Press Ctrl+S to save. Viewer writes a .wbkx file holding your pages, displays, positions and properties.
Viewer does not auto-save
Save regularly. By default Viewer keeps a few backups of previous saves, so you can recover an earlier version. See Workbooks and pages.
Next time, Ctrl+O re-opens it. Because the workbook holds layout and not data, you can load a different session, and the same plots work.
Check yourself#
You are ready to move on if you can:
- Explain why a display is blank before any session is loaded.
- Load a session and add parameters from the Parameter Browser.
- Zoom to a region and jump to a lap.
- Put two sessions in one set and tell them apart in the legend.
- Save and re-open a workbook.
If something does not look right#
| Symptom | Try |
|---|---|
| The Session Browser is empty | Add a source (folder or database) in Session Sources, then press F5 to refresh. |
| A session will not load | Check your licence options and that the file or database is reachable. |
| Display shows "No Data" | Check the cursor is inside the data range, and that the parameter has data at that time. |
| Everything is slow | Reduce the number of parameters per display, close displays you are not using, and zoom to the area of interest. |
More in Working with displays.
Next#
How Viewer is organised puts names on what you just did, so the rest of the docs read more easily.