Laps, markers and comparing runs#
Course step 5 of 9 · about 15 minutes
Most analysis in Viewer comes down to one question: how does this run differ from that one? Laps, markers and compare sets are the tools for answering it.
Laps: the unit of comparison#
A lap is a labelled segment of a session. In motorsport it is a trip round a circuit. In other work it is whatever repeated cycle or phase your data has: a test cycle, a warm-up, a ramp, a stage of a procedure.
Laps are not just labels. Viewer uses them to:
- jump around the session (previous lap, next lap, fastest lap),
- set the time range displays show,
- overlay runs on one another,
- calculate statistics per segment, and
- decide where alarms and formatting apply.
Where laps come from#
- The data source emits them. Many loggers mark lap boundaries as they record.
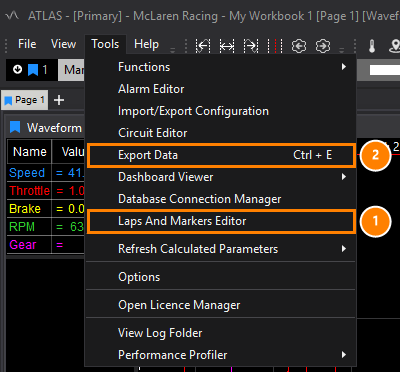
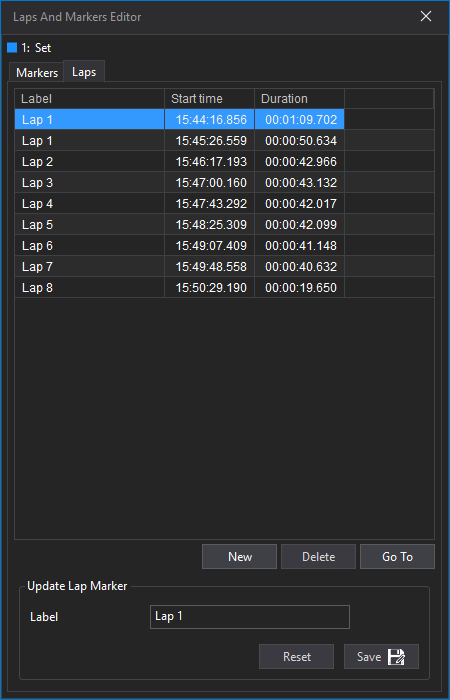
- You define them. Open Tools > Laps And Markers Editor and use the Laps tab to create, rename, delete and jump to laps. This is how you segment data whose source has no laps.
Laps are read-only while a session is live
You can see laps arriving during a live session, but you can edit them only once the session becomes historical.
Out laps and in laps are special lap types that help you exclude non-representative data. See Laps.
Markers: points and ranges you define#
A marker is a labelled point in time, or a range, with a type, a description and optional labels carrying values and units. Use markers for things that are not laps: a fault, a step change, a manoeuvre, a region you want to come back to.
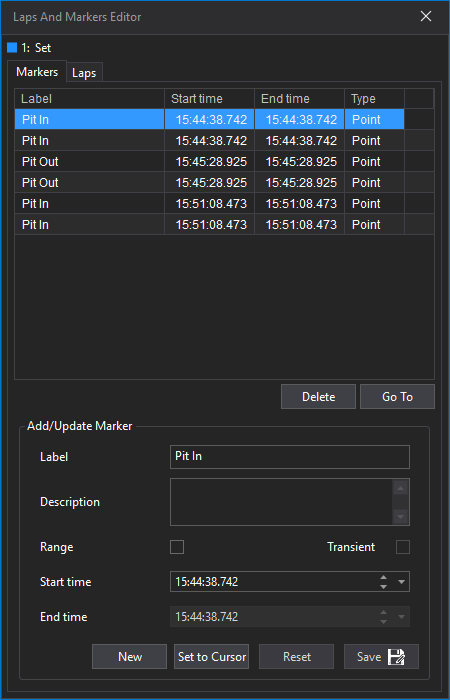
Markers appear on the Timeline, and their labels show as tooltips. You can add them in the Markers tab of the Laps And Markers Editor (fill in a label, set the start time, or use Set to Cursor, then Save), or by code with the SQL Race API (useful when a model or script finds the interesting regions for you). See Markers.
Navigating with the Timeline#
The Timeline along the top of the window shows the loaded set.

From it you can:
- double-click a lap to make it the timebase,
- use the Previous Lap, Next Lap and Fastest Lap buttons,
- jump to a marker, and
- choose the Compare Set Scope: Whole Session, Single Lap, Fastest Lap or Absolute Session, with time offsets between sessions.
Comparing runs#
Overlay in one display#
Put two or more sessions in the same set (select each in the Session Browser and press Enter). A Waveform shows all of them, with one header and colour stripe per session in the legend. Click a session's colour square in the Compare Sets List to hide or show it.
Side by side in different sets#
Load a session into a new set (Ctrl+Enter), and point one display at each set with Shift+1, Shift+2, and so on. Use Ctrl+1, Ctrl+2 to switch a whole page at once.
Align runs before you compare them#
Two runs rarely start at exactly the same instant. To align runs that start at different times, use the time offsets in the Timeline, or choose Drag Session Offset in the Waveform context menu, pick the session and drag its traces until features line up.
The Lap Trigger Offset session property is something different. It is a distance in metres from the lap trigger to the Start/Finish line, and it corrects for sessions recorded with the trigger in different physical positions. Edit it in the Session Properties panel of the Session Browser.
Compare against distance, not just time#
In a Waveform, you can plot against distance instead of time. This compares what the system does at the same place or point in the cycle across runs, which time alone cannot. In Distance mode, the Waveform can show a Time Difference (TDiff) between sessions.
Summarise per lap#
The Summary display gives one row per lap, with a statistic such as minimum, maximum, mean or end value for each parameter, as a table or plot.
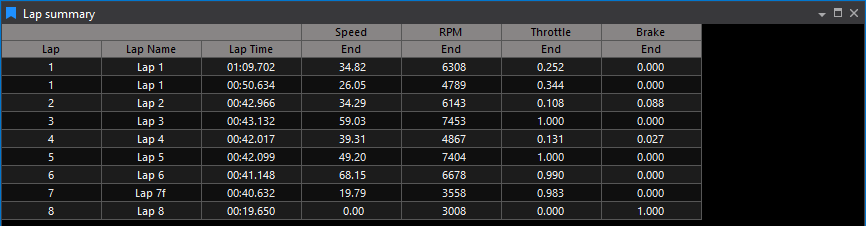
The Scatterplot, Histogram and FFT displays answer other questions about the same data. See the display comparison table.
Try it#
Using two sessions of the same kind of run:
- Load both into one set and open a Waveform with two parameters.
- Use Fastest Lap in the Timeline to bring the best lap into view in each.
- Add a Summary display and read off the per-lap statistics.
- Switch the Waveform to Distance mode and look at the time difference between the two sessions.
- Add a marker where something interesting happens, with a label describing it.
- Save the workbook.
Next#
Channels and calculated parameters covers finding signals quickly and deriving new ones.