How Viewer is organised#
Course step 4 of 9 · about 10 minutes
In the previous step you loaded data and drew plots. This page names the pieces, and shows how they connect. Once the model is clear, the Viewer reference pages become much easier to navigate.
The model in one picture#
graph TD
    SB["Session Browser"] --> SES["Sessions"]
    SES --> SET["Compare set"]
    WB["Workbook (.wbkx)"] --> PG["Pages"]
    PG --> DSP["Displays"]
    DSP --> PAR["Parameters"]
    SET -. "a display shows one set" .-> DSP
In words:
Sessions are loaded into compare sets using the Session Browser. A workbook holds pages, pages hold displays, and each display shows parameters from the set it is pointed at.
The dotted line matters most. A display is not attached to a particular file. It is attached to a set, and whatever is in the set is what you see.
The model on screen#
This is the workbook you built in the previous step.
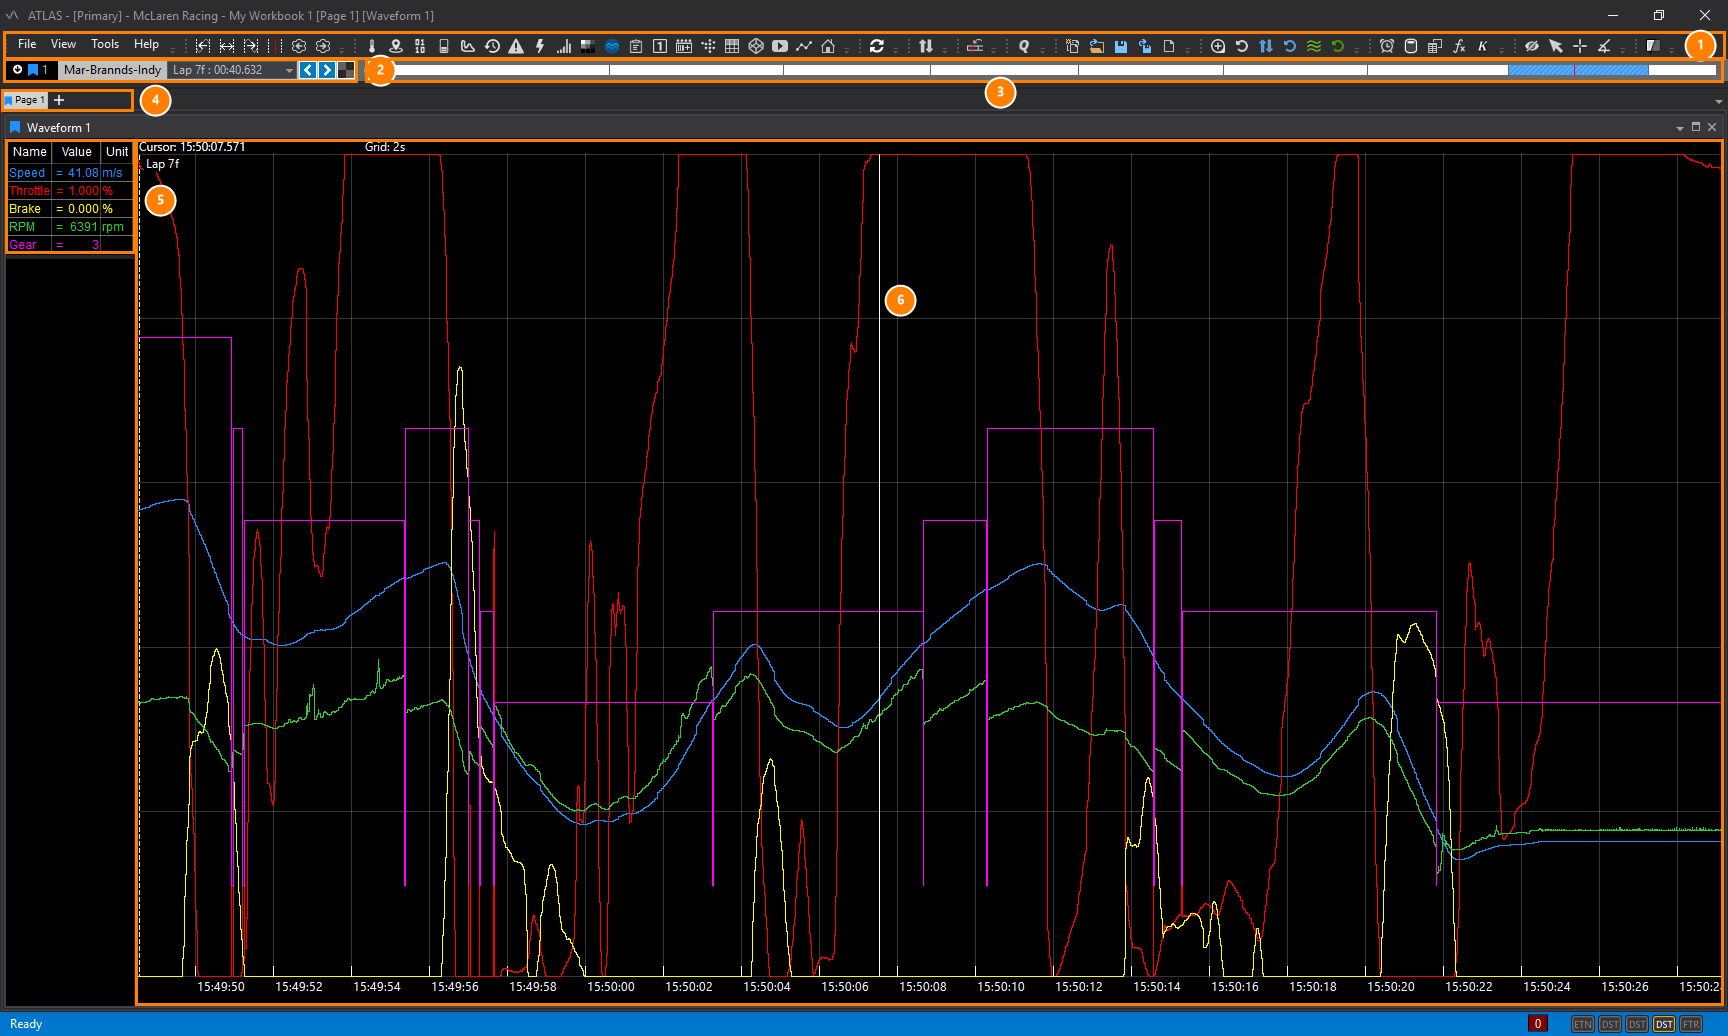
- Menus and toolbars. Every action, including adding displays and opening the browsers.
- The set and its session. The set number and colour, the session loaded into it, and the lap the displays are showing.
- Timeline. The whole session, lap by lap. The shaded region is the time range on screen.
- Page tabs. Each tab is a page in the workbook. Click
+to add one. - Legend. Each parameter on the display, with its value at the cursor.
- Display. Here a Waveform, plotting the parameters from the set against time.
The pieces#
| Piece | What it is | Where to learn more |
|---|---|---|
| Session | One recording, with metadata, laps, events and parameter data. Historical (finished) or live (still arriving). | Sessions |
| Session Browser | The place you find, load, record and manage sessions. Ctrl+L. |
Session Browser |
| Compare set | One or more sessions loaded together. Displays point at a set. Sessions in the same set overlay. | Loading sessions |
| Composite session | Several sessions appended into one continuous timeline, with a green separator where they join. | Loading sessions |
| Workbook | Your saved workspace: pages, displays, their layout and properties. | Workbooks and pages |
| Page | A tab within a workbook that holds displays. Group related displays on a page. | Workbooks and pages |
| Display | A single visualisation: Waveform, Numeric, Scatterplot and so on. | Displays |
| Parameter | A measured signal (or a calculated one). Grouped by application. | Parameters |
| Timebase and Timeline | The time range displays show, and the control for it. | Timebase and Timeline |
What is saved where#
| Thing | Saved in | Notes |
|---|---|---|
| Sessions and their data | A SQL Race database, or an .ssn2 / .ssn file |
Not in the workbook. |
| Layout, display properties | Workbook (.wbkx) |
Save with Ctrl+S. Not auto-saved. |
| Functions, alarms, circuit definitions, bit configuration files | Separate files opened with the workbook | If they are missing, displays that need them appear empty. |
| Your settings and files as a bundle | Configuration bundle (.acgx) |
Use Tools > Import/Export Configuration to share a set-up with a colleague. |
Properties have three levels#
When you change how a parameter or display looks (colour, scale, format), Viewer remembers how widely the change applies. The icon next to each property tells you:
| Icon | Level | Meaning |
|---|---|---|
| ◻️ Square | Default | The value from the data source. |
| ♦️ Diamond | Local | Changed for this display only. |
| ⚪ Circle | Global | Applies to all displays of this type, including new ones. |
If a colour changed everywhere and you did not mean it to, a global property is the likely cause. Right-click the property and choose Clear Global Value.
Eight shortcuts worth learning first#
| Keys | Does |
|---|---|
Ctrl+L |
Open the Session Browser |
Ctrl+Q twice |
Quick access: add a display by name |
P |
Open the Parameter Browser |
D |
Open Display Properties |
Shift+1 … Shift+0 |
Point the selected display at set 1 to 10 |
Ctrl+1 … Ctrl+0 |
Point the whole page at set 1 to 10 |
Ctrl+S |
Save the workbook |
F1 |
Open the built-in help |
The full list is in Keyboard shortcuts.
Next#
Laps, markers and comparing runs uses these pieces for the job most analysts do every day.